When it comes to answering the question, “what causes a site to earn more answer engine traffic,” I have two disparate things going for me that create a unique opportunity:
- A bit of academic training in, and a long professional history of, data-driven analysis of complex systems.
- Access to a LOT of instances of Google analytics and marketing systems of records with normalized views across them.
Add to that the fact that I just recently built out some Osiris functionality to create aggregate queries across all data sets and I realized, “hey, it wouldn’t be too hard to take a decent statistical look at this.” Not that I don’t find endless speculating and arguing on LinkedIn to be fascinating. I just don’t trust my instincts nearly enough to guess at stuff.
Let me get the spoiler out of the way quickly and then dive into specifics.
Far and away the best predictor of a site earning a lot of traffic from answer engines was whether that site was earning a lot of traffic from search engines.
Now because I realize this just sounds like copium from someone comfortable with SEO as a channel, I want to elaborate on methodology and specifics. And I also want to dive into a few subtleties and conclusions that aren’t immediately obvious. Because the actual takeaway here isn’t just “do traditional SEO and answer engine traffic will take care of itself.”
Methodology (In Plain English, I Promise) and Caveats
 One thing that I want to mention prominently is that everything about this is anonymized. We NDA with everyone that gives us systems of record and we take that obligation seriously.
With that out of the way, let’s start off talking about my “stack” for this. We use BigQuery and a proprietary modeling system for our Osiris offering and use Airbyte to ingest client data into that from GA4 and other marketing systems. For the purposes of this experiment, I ignored other analytics traffic sources for both consistency and to ensure that I was comparing apples to apples.
I limited the study to a subset of GA4 instances to which we have access, totaling exactly 30. These instances ran the gamut of traffic from almost nothing to 7 figures per month. That was intentional.
From there, I used VSCode, Python, Pandas, and ChatGPT to vibe code up a regression analysis. I have a lot of software engineering in my background, but have never used Pandas, and this let me run the experiments in hours rather than scaffolding something up over a week.
With all of this in place, I wrote a series of SQL queries against BigQuery to extract apples-to-apples values across the GA4 instances for the experiment. For instance, this allowed me to build lists of things like “total channel traffic volume in 2025” and “number of distinct URLs” across all the client BigQuery schemas.
With all of this in place, I ran regression analysis. I won’t get into the weeds of that unless any of you reading specifically request, at which point I could sanitize the code and write a follow-up post.
A False Start: Answer Engine Share
 I approached this in iterative fashion, starting simple. The first dependent variable I decided to look at was “answer engine share,” or “percentage of site traffic that comes from answer engines.” (You can see this here in our public Osiris demo, and average AE share between 2-4% is typical).
Basically I reasoned that larger sites would have larger traffic of all kinds (a hypothesis that I would of course later validate and am writing this post about). So I figured I’d control for that by seeing if any other variables predicted a higher percentage of answer engine traffic. Meaning, if pound for pound, some sites were earning WAY more than others, I wanted to examine the predictive variables about those sites.
Well, all for naught. Absolutely nothing I tested showed even a slight correlation for predicting a higher answer engine share, including:
- Organic traffic volume
- Number of URLs
- Keyword coverage % (basically what percent of a site’s URLs targeted organic intentionally)
- Domain authority (Moz)
- Rank performance (we have a model that projects an expected rank for a domain/keyword pair and I measured a site’s tendency to underperform/overperform the prediction as a proxy for “good at SEO”)
- Number of “commercial” URLs (proxied this with the percentage of URLs containing obviously commercial tokens, like “best” and “comparison” and such)
This isn’t to say that none of those things matter in any way at all. But it is to say that none of them was even remotely predictive of a higher answer engine share. Good at SEO, bad at SEO, large, small, authoritative, not, it didn’t matter at all.
So I switched gears and thought, let’s not overthink this. The goal here isn’t answer engine share (which you could trivially throttle up by disabling other site channels). You just want the bots to send you traffic. So let’s see if we have anything that predicts traffic.
Asking a Better Question: What Predicts More Answer Engine Traffic?
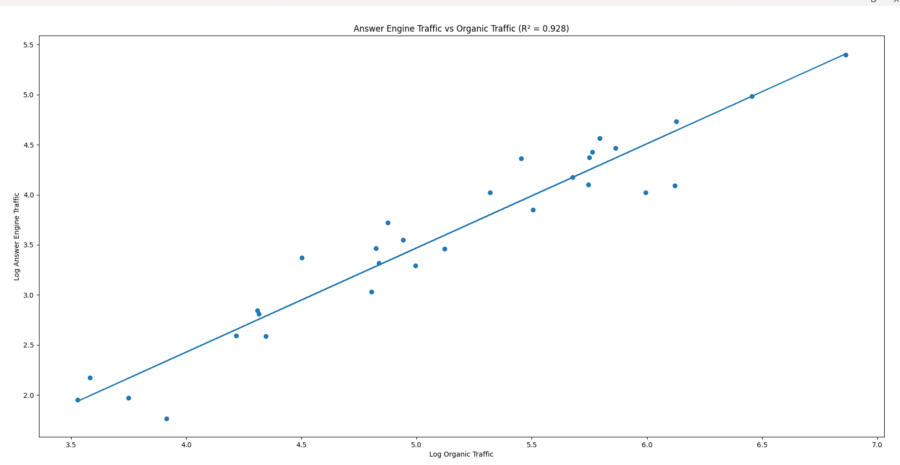
At this point, I switched the dependent variable in question to answer engine traffic. Well, more precisely, I switched it to the natural log of answer engine traffic, because all the cool kids like Moz create metrics that way. Or maybe because it stabilizes variance and allows for the fact that going from 1 visitor to 1,000 is a much bigger deal than going from 500,000 to 501,000. Either way.
 I then picked organic traffic (log of organic traffic) as the first independent variable to try.
When I reran the model with organic traffic as the predictor it was like a slot machine just paid out. Organic traffic explained approximately 93% of the variance in answer engine traffic. The biggest determinant of answer engine traffic is whether you already have meaningful organic search traction.
 Secondarily, total site traffic was also strongly predictive (around 90%), but not quite as predictive as organic traffic. Domain authority was somewhat predictive, but with a much lower score, and the rest of the variables that I’d tried in the last round had no correlation. And various flavors of traffic and domain authority also correlate heavily with one another.
What about the Other 7%?
 This is where a little intrigue enters the mix on an ongoing basis. I would have thought that some of the other concerns would contribute, especially given that AE traffic tends to land more on commercial pages. But nothing so far.
So we’re in a state that’s kind of like when someone discovered Neptune and the solar system was mostly settled, but there are still some possible dwarf planets and planet X-es or whatever. There’s a compelling explanation for most of it, but some interesting mysteries still out there at the margins.
With this analysis, there are positive and negative outliers in the AE/Organic relationship, and those outliers have SOMETHING in common. It just remains to be seen what variable(s) those are, and those variables will become the evolution of the SEO playbook into a GEO playbook.
Practical Takeaways
So as you can see, this is neither a “just do SEO and you’ll be fine” post, nor is it the magic beans you tend to see masquerading as “GEO strategy.” And it’s also not complete, because I intend to do more work here when I have a chance (more on that in a second). So here’s how I’d frame what you can take away.
- If you want answer engine traffic, your best bet is to grow your site and your brand, particularly organic (which makes sense, since both search and answer engines follow a Q&A paradigm).
- It’s an interesting figure, but there is no point in making “answer engine share” a first-class goal. In fact, that’s probably counterproductive.
- Whatever you’re adding to your GEO playbook, you can probably skip generating a lot of URLs or focusing exclusively on commercial terms, except inasmuch as that fits into your traditional organic strategy.
- You’re not going to on-page GEO hack your way to a large presence in answer engines without doing the traditional build work of the SEO channel.
What We’ll Do Next
 As I alluded to earlier, I’m still interested in chasing the remaining 7%. And I have some things that I’d like to test, though some of this data is far easier to gather than others and not all of it has equal precision and fidelity. Caveats aside, I’m thinking:
- Content form mix (definitions, tutorials, comparisons, etc)
- Prevalence of on-page GEO tactics
- Branded search volume
- Content freshness/age
- Crawler hygiene
- Historical site performance (seems unlikely to matter, but you never know)
If you have any thoughts on these candidate variables or input on what I might be forgetting, I’d love to hear it. Hopefully we can start to tease out some meaningful, non-anecdotal data about what sorts of tactics actually work as the landscape changes.