
Bear with me here, folks, because I have a somewhat wonky analysis of the economics of content spend for you. But I’ll make up for that in two ways:
- I’ll use graphs and visuals and a remarkable amount of self-restraint to make the topic approachable,
- and I’ll show you how to spend your content budget so much more efficiently that it’s worth humoring me, I promise.
A Warm-Up Car Analogy

Let’s ease in with some figurative language. Imagine that you buy a nice car of some kind. Since I’m not really much of a car guy (seriously, I recently tried to launch a campaign to destroy my own car), I’ll just pick one at random and say Ferrari. Those seem nice.
You buy your Ferrari, which sets you back a good bit of money. And now, what do you do with it, exactly, in terms of maintenance? Do you refuse to pay for oil changes, tire rotations and tune-up, reasoning that you’ve already achieved “have a nice car” and spent a bunch of money, so why waste any more?
No, of course not. You almost certainly continue to spend a relatively modest amount of money, compared to the purchase, on upkeep. After all, you didn’t buy the thing to have it become gradually undriveable and broken over the course of a year or two.
Now strictly speaking, one could (try to) argue that this is a form of sunk cost fallacy. You’re continuing to spend too much money to justify a previous decision to spend too much money. But this ignores a crucial point, which is that you’re going to measure the utility of the car over the duration of the entire ownership period, which means that the initial purchase is realistically more like a large deposit than the entirety of purchase price.
The same logic applies with your site’s content inventory. Except I’d argue that the maintenance spend on content is WAY more efficient than the maintenance spend on your Ferrari.
Establishing Some Ground Rules

At this point, I’m going to ask you to accept a few things axiomatically. It’s not that I can’t supply the theory to back these claims, but rather that I’m navigating the wonkiness trade-off here. If anyone reading is interesting, let me know, and I can create prequels to this post.
- Traffic to your site’s URLs through search channels has a lifecycle, wherein it tends to peak at 12-18 months and then starts to gradually decay.
- An average URL decay rate of 5% month over month is a reasonable figure if you simply abandon the content.
- You can cut that figure to a much smaller percent with refresh activities.
- Once a site gets up to six figures of monthly traffic, you can’t refresh your way out of decay. You have to produce somewhat substantial amounts of new content to break even.
If you assume I have a bit of experience here and take these things at face value for the sake of argument, it’s going to be a lot easier to understand the rest of this analysis.
1 vs 5 Percent: A Tale of Two Decay Arcs
To understand why content maintenance makes so much economic sense, you need to first have a sense of how much non-maintenance bleeds you, cost-wise. Here is a comparison graph to drive this home, visually:
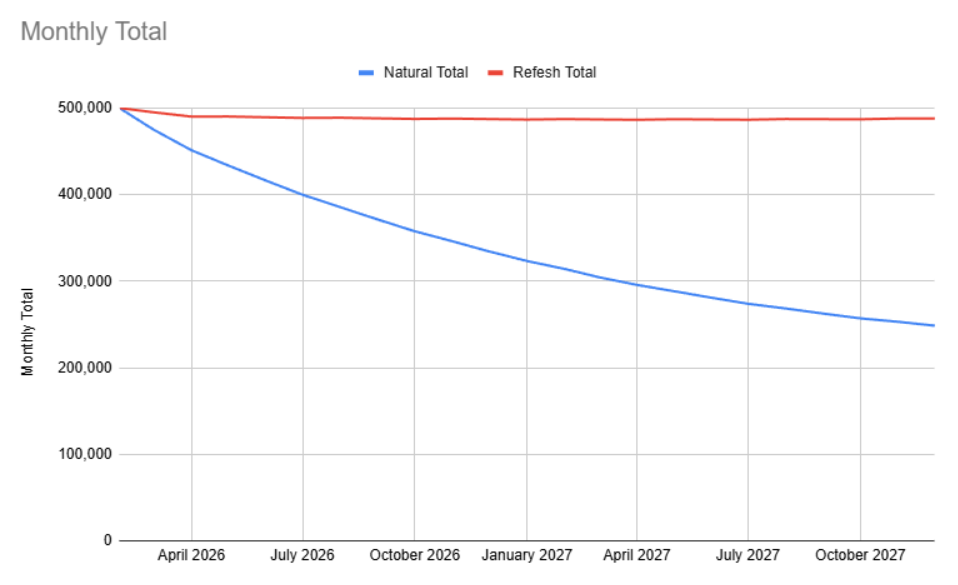
Both of these graphs assume that you’re earning half a million organic visitors per month entering 2026, and both assume that you continue to create one new organic-targeting URL per week. Here is the difference.
- The “natural total”, blue graph, assumes a 5% month-over-month traffic decay, which is reasonable for unmaintained content.
- The “refresh total”, red graph, assumes a 1% MoM traffic decay, which is reasonable for maintained content. (Nothing is truly evergreen, but that’s a topic for another time).
Maintaining that content while producing one new URL per week will allow this site to, more or less, sustain their half million visitors per month. Failing to maintain it will see the traffic decay to about half of its monthly peak at the end of two years.
Going from 500K to 250K visitors per month over two years seems like a bummer, but you need to see this in absolute terms to really understand how significant the loss of traffic (and thus leads and other down funnel metrics) is.
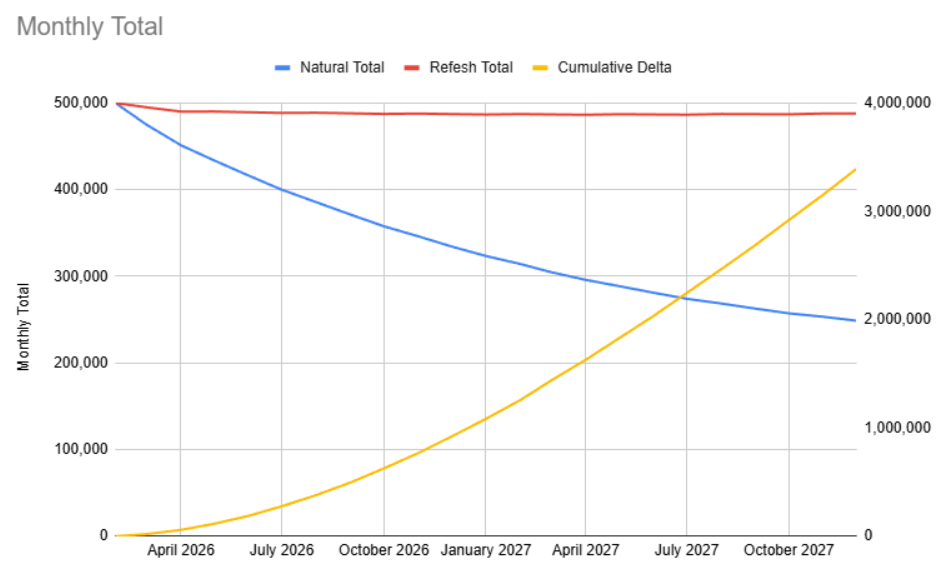
This is the same graph, but it adds in a line and figures on the right. This yellow line represents the cumulative lost traffic for the non-maintenance site over these two years. By the end of 2027, non-maintenance has cost the site more than 3.5 million visitors.
Looking at Spend Efficiency: Cost Per Lead
Missing out on 3.5 million visitors by not maintaining the content obviously makes you wonder about lost opportunity. But you might still reasonably ask whether it’s worth the maintenance.
After all, you have to spend money that you could simply not spend in order to get those 3.5 million visitors. So it might not be worth it in the same way that it might not be worth it for some companies, depending on GTM strategy, to build half a million visitors per month in the first place.
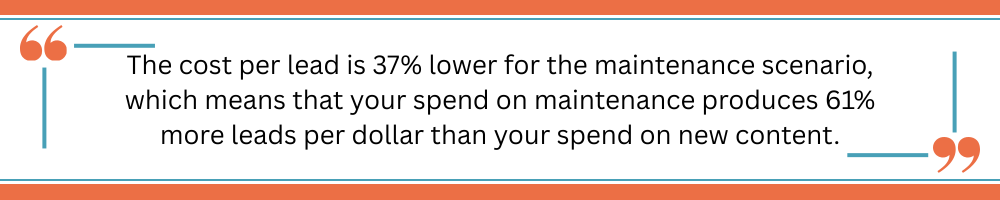
To address this concern, let’s normalize by cost per lead, with and without the maintenance.
I’ll start with a spoiler. The cost per lead is 37% lower for the maintenance scenario, which means that your spend on maintenance produces 61% more leads per dollar than your spend on new content.
Below is a screenshot from our modeling sheet template, where you can see assumptions documented in purple (versus calculations, which have no color). To be specific about this, here are the documented assumptions, all of which I would argue, from extensive experience, are reasonable.
- You can effectively maintain content for 5% of the cost of creating new content, as far as staving off decline is concerned.
- You will qualify leads at a higher rate on maintained content than on unmaintained content, since part of any good maintenance plan should be revisiting and optimizing CTAs (or simply adding them when they didn’t historically exist). In this example, we’re qualifying leads 20% more effectively.
- Efficient, low-cost maintenance can reduce but not eliminate traffic decay (5% vs 1%).
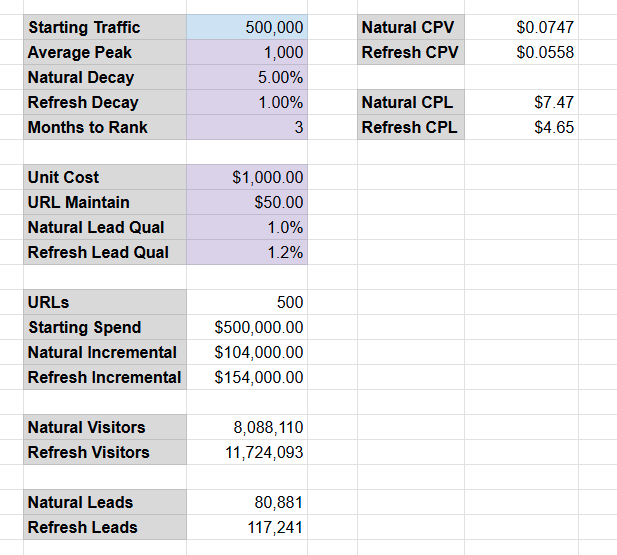
There are other assumptions here as well, such as the starting traffic, time to rank, and average peak. But those are going to come out in the wash when comparing our two scenarios: content with and without maintenance.
With that in mind, what you’re looking at is the comparison of total leads brought to the site through two scenarios:
- You start with half a million visitors per month and do nothing but produce one new URL per week for two years.
- You start with the same half million, produce the same one new URL, but also do routine content maintenance on existing URLs.
To be clear, in the maintenance scenario, you spend $50K more than you do in the fire-and-forget scenario. But you produce WAY more leads.
The Key Lesson: Budget for Maintenance from the Jump

Here’s how I’d think about this.
Once you’ve done the hard, expensive work of creating content and building organic traffic as a lead generation channel, you have a much cheaper option for future lead generation: content maintenance. That option only becomes available with your already significant investment, but it does become available. And when it does, it’s 61% more efficient, per dollar, at generating leads than the hard, expensive initial option.
So in the end, I’d suggest budgeting for maintenance from the outset. In other words, if you have $1M to spend on organic as a channel, don’t think of all of that as earmarked for net-new URLs. And don’t think of the maintenance piece as something that you’ll simply figure out later.
If you’re capped at $1M, think about earmarking $900K of that for new content and $100K for maintenance. Because the last $100K on maintenance will generate a lot more leads than it would if spent on new content.
Or go back to the car analogy. Don’t buy a Ferrari if the sticker price means you can’t pay for oil changes and tire rotations. The maintenance is as core to the outcome as the purchase.